Simon Rookyard presented Quintessa’s new algorithm for rating sports teams and individuals at the Operational Research Society’s annual conference, held 3rd-5th September 2019 at the University of Kent.
The Operational Research Society’s 61ˢᵗ annual conference was held at the University of Kent in September 2019. The conference was attended by a wide range of delegates from across industry and academia.
Simon Rookyard presented a new algorithm that Quintessa has developed to rate sports teams or individual players by ability. Rating sports teams/individuals is a complex and dynamic problem with a wide range of applications, from competition organisers and governing bodies seeding teams to ensure competitive matches (or to separate the better teams/individuals in knock-out tournaments), to sports fans and pundits predicting results for up-coming matches.
Quintessa's new “N-estimates” algorithm draws on our mathematical modelling expertise. It differs from most existing rating algorithms by acknowledging that every team/individual has good and bad days. This variability in performance is modelled specifically for each team/player, meaning the calculated ratings are both data-driven and appropriately account for how well (or otherwise) a team’s or individual’s performance can be predicted. See Figure 1. The N-estimates algorithm is versatile: With only limited changes it could be adapted to any of a wide range of team and individual sports.
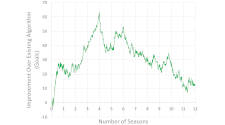
Simon also presented a test case comparing the algorithm’s predictions of Premier League football results with those of a leading football-specific algorithm; the pi-rating algorithm. The N-estimates predictions are shown to be more accurate on average. See Figure 2. The difference is especially pronounced at earlier times, suggesting N-estimates is also quicker to react to new data.

