Quintessa has recently updated its in-house software tools for the visualisation of mathematical model output. As well as improving our existing tool, QPAC Viewer, we can now export model output data to VTK format using ShapeShifter. This enables us to harness the power of third-party visualisation tools, such as ParaView to interrogate 3D data in new ways.
Quintessa makes use of an in-house general-purpose mathematical modelling tool called QPAC to address a wide range of problems for our clients as part of its consultancy services.
QPAC Viewer is an associated tool we have developed that is designed to visualise QPAC model outputs in 3D; either as standard 3D objects or in an abstract compartment/interface form for investigating model connectivity (in which compartments are represented as solid 3D shapes and interfaces between them as arrows). QPAC Viewer enables the user to:
- navigate easily between QPAC subsystems and view model outputs quickly;
- zoom, pan and rotate in order to inspect all parts of their model;
- select any output parameters and view via colour coding;
- hide compartments based upon rules created by the user;
- produce time series outputs at user-defined locations.
QPAC Viewer has recently been updated to be cross-platform (Windows and Linux OS), with improved speed and memory usage for large models.

ShapeShifter is software that has been developed to allow QPAC model outputs to be viewed using third-party visualisation tools. Any software that supports the VTK file format can be used (e.g. ParaView). This allows access to a range of additional visualisation techniques such as contour plots and iso surfaces.
An example of using ParaView to visualise the outputs of a QPAC model is shown below. The model simulates the transport of a solute through a 3D domain with a heterogenous conductivity field. Iso surface and slice capabilities in ParaView have been used to visualise the evolution of the solute plume inside the domain.

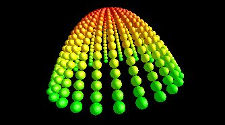
ShapeShifter can display parameter values as spatial coordinates. As an example, this can be used to visualise the 2D wave equation solution as a 3D surface, as shown below.
