Quintessa

Containment Risk Assessment (CRA) for Underground CO₂ Storage Using Multiple Lines of Evidence

Organised by SPE Aberdeen and PESGB, the Carbon Capture, Utilisation and Storage (CCUS) virtual Conference was held from 21st to 24th February 2022, and featured current CCUS projects, case histories, technical initiatives, operating practices and panel discussions.

Richard Metcalfe attended the conference and gave a presentation on the importance of using multiple lines of evidence in the containment risk assessment (CRA) for underground storage of CO₂. Such an assessment involves making judgements about risks based on multiple lines of evidence, and presenting the outcomes to a range of stakeholders, including regulators.

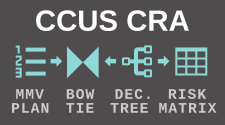
A structured approach was presented, based on a combination of scenarios, decision trees, bowties and risk matrices. See Figure 1. Using real-world examples, the approach was illustrated by showing how it has been used previously to assess the risk of CO₂ leakage from wells, including those that are part of a CCUS project or legacy wells unrelated to the project.

There is a growing international consensus that CCUS will be necessary to expedite a cost-effective transition to a net zero carbon emitting economy and it will require an effective and transparent CRA for any proposed CO₂ storage site.

Quintessa is committed in continually building its existing expertise and knowledge in the sustainable utilisation of the subsurface by providing a leading-edge scientific input and consultancy to facilitate a low carbon future.

A diagram illustrating the process.
    
  Process is: MMV Plan (1) informs Bow Tie (2). Decision Tree (3) informs Risk Matrix (4) and Bow Tie.

  Details provided on each are:

  (1) MMV (Measurement, Monitoring and Verification) plan is used to ensure conformance and containment. This is illustrated with an example having stages a. assessment and characerisation, b. operations and c. post-closure.

  (2) Bow Tie communicates:

  * Scenarios - pathways from left to right through the Bow Tie.
  * Phenomena that are risky.
  * Mitigation and preventative measures.
  * (emphasised) It does not quantify risk.

  This is illustrated with a Bow Tie diagram assessing CO₂ leakage, with threats shown on the left-hand side of the bow tie each with associated preventative measures, and consequences of leakage on the right-hand side each with associated monitoring and mitigation measures, and a separate central category of hazards.

  (3) Decision Trees are used to estimate:

  * Likelihood of threats being realised.
  * Severity of outcomes if they are.

  This is illustrated by a decision tree with a quantitative assessment of the hypothesis 'Well bore/seal failure will not lead to significant disturbance of the stored CO₂'

  (4) Risk Matrices are used to communicate the magnitude of risks based on the probability and severity of outcome. This is illustrated using a matrix with Impacts shown horizontally (Insignificant, Low, Moderate, High, Terminal (Project Stops) and Probability shown vertically (Very Likely, Likely, Equally Likely/Unlikely, Unlikely, Very Unlikely) and colour coding within the matrix itself together with some explanatory comments, such as 'Wells will leak'.

Figure 1: A structured approach to a Containment Risk Assessment for Carbon Capture, Utilisation and Storage